Telemetry Devices
You probably want to gain additional insights from a race. Therefore, we have added telemetry devices to Rally. If you invoke
esrally list telemetry, it will show which telemetry devices are available:
dm@io:Projects/rally ‹master*›$ esrally list telemetry

    ____        ____
   / __ \____ _/ / /_  __
  / /_/ / __ `/ / / / / /
 / _, _/ /_/ / / / /_/ /
/_/ |_|\__,_/_/_/\__, /
                /____/


Available telemetry devices:

Command    Name                   Description
---------  ---------------------  -----------------------------------------------------
jit        JIT Compiler Profiler  Enables JIT compiler logs.
gc         GC log                 Enables GC logs.
jfr        Flight Recorder        Enables Java Flight Recorder (requires an Oracle JDK)
perf       perf stat              Reads CPU PMU counters (requires Linux and perf)

Keep in mind that each telemetry device may incur a runtime overhead which can skew results.
You can attach one or more of these telemetry devices to the benchmarked cluster. However, this only works if Rally provisions the cluster (i.e. it does not work with --pipeline=benchmark-only).
jfr
The jfr telemetry device enables the Java Flight Recorder on the benchmark candidate. Java Flight Recorder ships only with Oracle JDK, so Rally assumes that Oracle JDK is used for benchmarking.
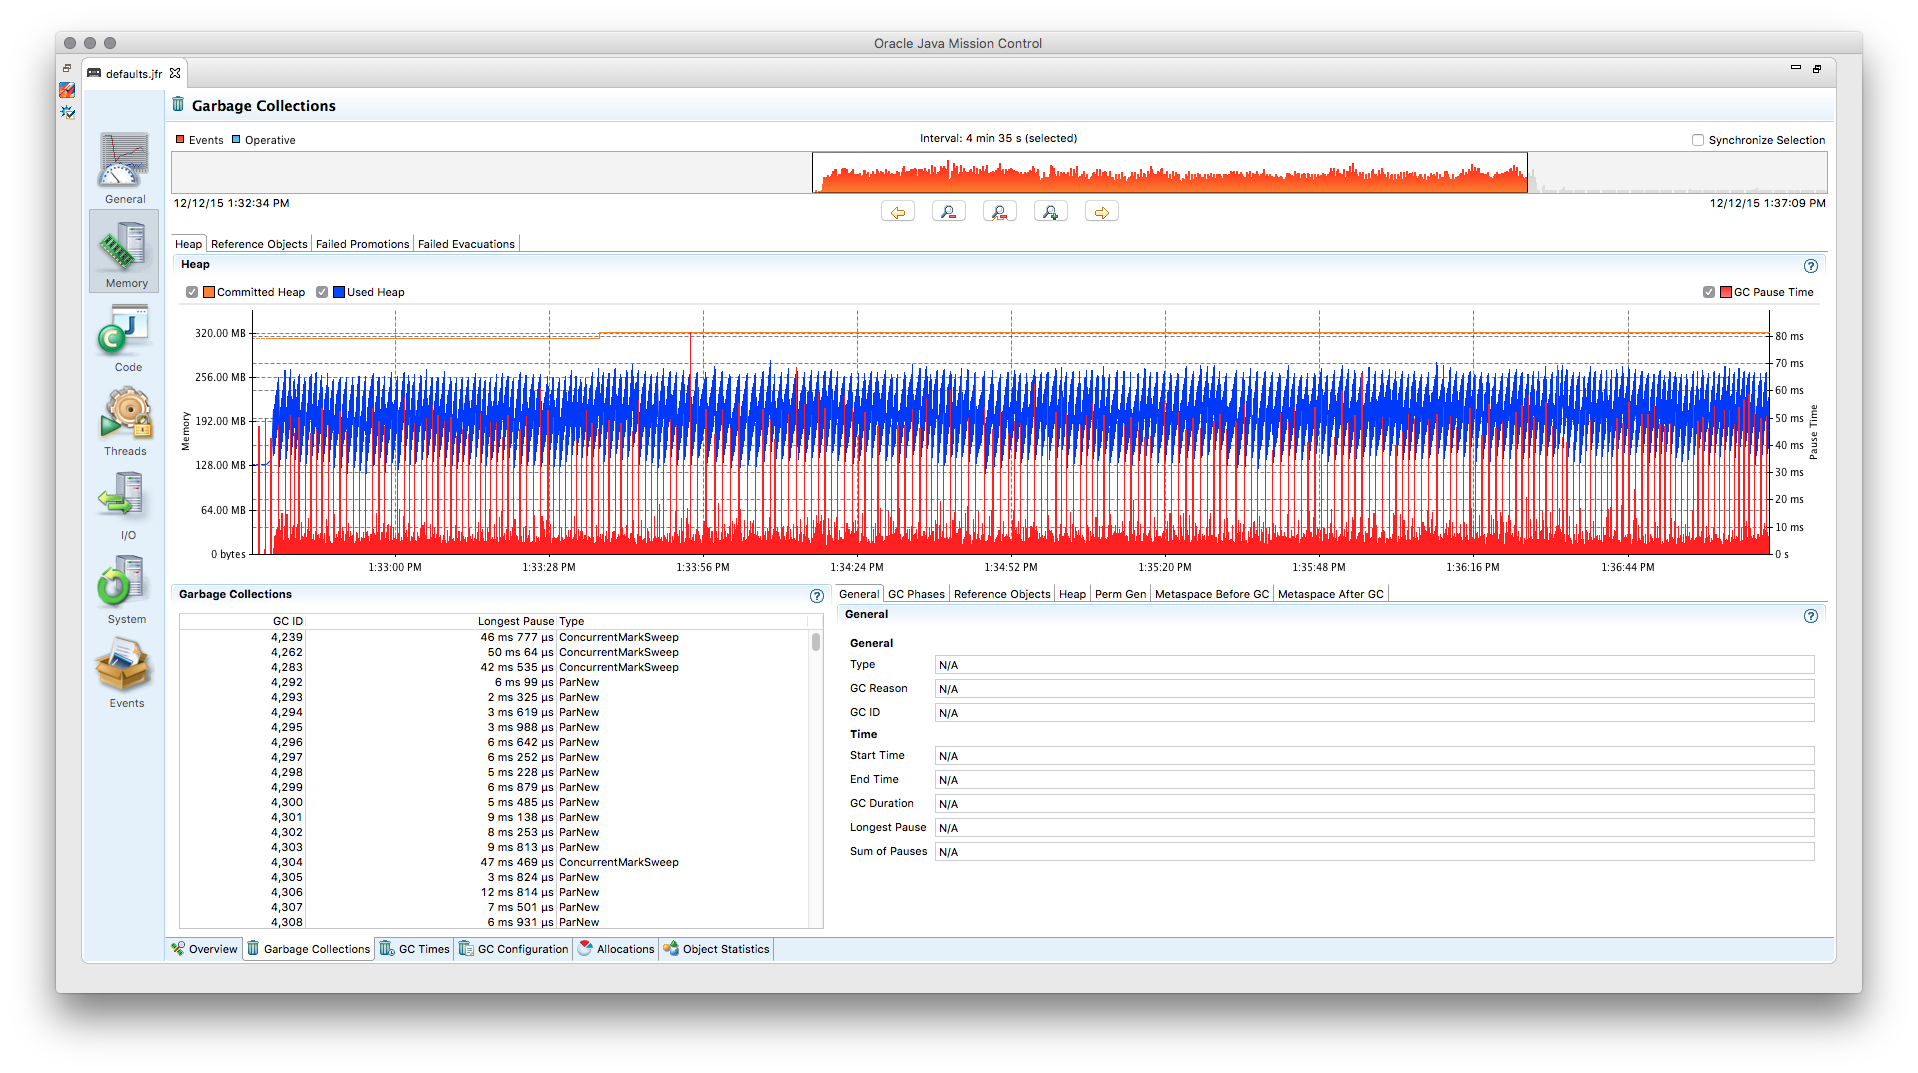
To enable jfr, invoke Rally with esrally --telemetry jfr. jfr will then write a flight recording file which can be opened in Java Mission Control. Rally prints the location of the flight recording file on the command line.
Note
The licensing terms of Java flight recorder do not allow you to run it in production environments without a valid license (for details, please refer to the Oracle Java SE Advanced & Suite Products page). However, running in a QA environment is fine.
jit
The jit telemetry device enables JIT compiler logs for the benchmark candidate. If the HotSpot disassembler library is available, the logs will also contain the disassembled JIT compiler output which can be used for low-level analysis. We recommend to use JITWatch for analysis.
hsdis can be built for JDK 8 on Linux with (based on a description by Alex Blewitt):
curl -O -O -O -O https://raw.githubusercontent.com/dmlloyd/openjdk/jdk8u/jdk8u/hotspot/src/share/tools/hsdis/{hsdis.c,hsdis.h,Makefile,README}
mkdir -p build/binutils
curl http://ftp.gnu.org/gnu/binutils/binutils-2.27.tar.gz | tar --strip-components=1 -C build/binutils -z -x -f -
make BINUTILS=build/binutils ARCH=amd64
After it has been built, the binary needs to be copied to the JDK directory (see README of hsdis for details).
gc
The gc telemetry device enables GC logs for the benchmark candidate. You can use tools like GCViewer to analyze the GC logs.
perf
The perf telemetry device runs perf stat on each benchmarked node and writes the output to a log file. It can be used to capture low-level CPU statistics. Note that the perf tool, which is only available on Linux, must be installed before using this telemetry device.